
|
|
Indicator:Children and young people’s experience of learning is positive |
Measures:School belongingnessSchool ClimateBullying in School |
School belongingness
THIS FORCES THE TABS TO CLOSE INITIALLY
In 2024, 60.7% of Year 4 to Year 10 SA students (from all school sectors) felt connected to adults at their school (61.4% in 2019).
Data Source: Wellbeing and Engagement Collection, Australia
Data for all children and young people
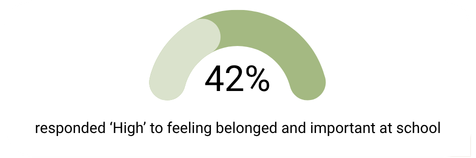
School students in Years 4-12 in South Australia reported the degree of school belongingness using a low, medium, and high wellbeing scale.
Proportion of Overall Year 4-12 student responses (2025)
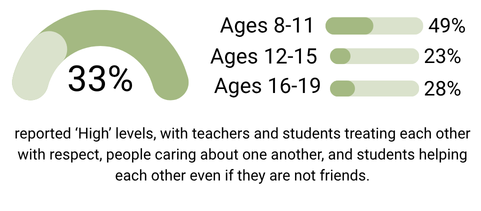
The section below presents the proportion of student’s level of belongingness to school, disaggregated by Year levels , NESB (Non-English speaking background) , EALD (English as an Additional Language or Dialect) and Disability .
Caveat: Percentages are calculated from students who provided a valid response to this question.
Data Source: Wellbeing and Engagement Collection, Australia
Data for Aboriginal children and young people
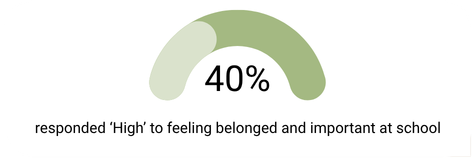
Aboriginal school students in Years 4-12 in South Australia reported the degree of school belongingness using a low, medium, and high wellbeing scale.
Proportion of Aboriginal Year 4-12 student responses (2025)
The trends shown in the line graph were tested for statistical significance to account for differences in group sizes across years. There were consistently higher proportions of ‘High’ belongingness among non-Indigenous students compared with Aboriginal and/or Torres Strait Islander students.
Significant differences in school belonging were observed across calendar years and between Aboriginal and/or Torres Strait Islander students and non-Indigenous students. Lower levels of High school belonging were evident in several later years, particularly in 2022 and 2023. While school belonging differed between the two groups overall, the pattern of change across years was broadly similar.
Caveat: Percentages are calculated from students who provided a valid response to this question.
Data Source: Wellbeing and Engagement Collection, Australia
Background and Rationale
Background:
School belongingness refers to the degree to which young people feel connected and valued at their school. School students in Years 4-12 in South Australia indicated their level of school belongingness in friends using a high, medium, and low wellbeing scale. It was based on their agreement with statements such as “I feel like I belong in this school” and “I feel like I am important to this school.”
For the disaggregation of school belongingness:
Year level breakdown is derived directly from student age as follows:
- Age_ID ≥ 8 and ≤ 11 is classified as Years 4–6
- Age_ID ≥ 12 and ≤ 15 is classified as Years 7–9
- Age_ID ≥ 16 and ≤ 19 is classified as Years 10–12
NESB (Non-English Speaking Background) codes represent the following categories:
- A (Aboriginal language): Students who identify as Aboriginal and who speak an Aboriginal language, including Aboriginal English. This excludes Aboriginal students who only speak standard Australian English. Codes TR, P1, P2 and P3 should not be used for Aboriginal students.
- P1 (Definition 1 permanent resident): Permanent resident or Australian citizen students born overseas with at least one parent or guardian from a non-English speaking background. This includes children adopted by English-speaking families who have maintained a linguistic link with their country of origin. If the P1 code is used, the student’s country of birth must not be Australia and the date of arrival in Australia must be completed.
- P2 (Definition 2 permanent resident): Permanent resident or Australian citizen students born in Australia with at least one parent or guardian born overseas and from a non-English speaking background.
- P3 (Definition 3 permanent resident): Permanent resident or Australian citizen students born in Australia, not included in the previous two definitions, who have maintained a cultural identity and family link with a language other than English.
- TR (Temporary resident): Students who are not permanent residents in Australia and who come from non-English speaking countries. If a student with a TR visa becomes a permanent resident, the NESB code needs to change (i.e., to P1, P2 or P3).
Please note this is students’ status at the time of undertaking the WEC.
EALD (English as an Additional Language or Dialect) refers to a flag used to indicate whether a student requires EALD support.
Students from a non-English speaking background (NESB) who need support to learn English must have the “EALD Support Required” flag enabled. When this is activated, it opens the EALD support details screen where the student’s Learning English: Achievement and Proficiency (LEAP) level is recorded. It is important to note that not all NESB students require EALD support.
The disability flag identifies students with a disability, where the values align with the Inclusive Education Support Program (IESP). Up to three codes may be recorded to identify the disability or disabilities of each student.
| Code | Disability |
|---|---|
| A | Autism Spectrum |
| C | Communication (Early Intervention) |
| D | Cognitive Delay (Early Intervention) |
| H | Hearing |
| I | Intellectual |
| L | Language |
| P | Physical |
| V | Vision |
| X | Complex social/emotional/behaviour needs |
| Y | Complex/acute health care |
Rationale:
This measure captures the extent to which children and young people feel accepted, respected, included, and supported within their school environment. Research has shown that a stronger sense of school belonging is associated with improved wellbeing, academic motivation, student engagement, participation in school activities, and more positive educational outcomes (Allen & Boyle, 2022).
School belonging is recognised within South Australia’s Wellbeing and Engagement Collection (WEC) as an important indicator of student wellbeing and engagement.
School Climate
THIS FORCES THE TABS TO CLOSE INITIALLY
In 2024, 60.7% of Year 4 to Year 10 SA students (from all school sectors) felt connected to adults at their school (61.4% in 2019).
Data Source: Wellbeing and Engagement Collection, Australia
Data for all children and young people
School students in Years 4-12 in South Australia reported the degree of school climate using a low, medium, and high wellbeing scale.
Data for Aboriginal children and young people
Background and Rationale
Bullying in School
THIS FORCES THE TABS TO CLOSE INITIALLY
In 2024, 60.7% of Year 4 to Year 10 SA students (from all school sectors) felt connected to adults at their school (61.4% in 2019).
Data Source: Wellbeing and Engagement Collection, Australia
Data for all children and young people
New Measure – Data coming soon