
|
|
Indicator:Children and young people play and participate in recreational activities |
Measures:Area and accessibility of green and blue space for children and young peopleSelf-reported participation in organised activitiesSelf-reported participation in sports or recreational physical activities |
Area and accessibility of green and blue space for children and young people
THIS FORCES THE TABS TO CLOSE INITIALLY
In 2024, 60.7% of Year 4 to Year 10 SA students (from all school sectors) felt connected to adults at their school (61.4% in 2019).
Data Source: Wellbeing and Engagement Collection, Australia
Data for all children and young people
Green Spaces:
This map illustrates the distribution of parklands across South Australia in relation to the number of children aged 0-17 years living in each statistical region (Statistical Area Level 2). Parkland areas are shown in green.
Each region includes:
- The total number of children aged 0–17 years
- The total area of parkland (square kilometres)
- The number of parkland areas
Regions are shaded according to the number of children per square kilometre of parkland.
The darker yellow areas indicate a higher number of children relative to available parkland, suggesting greater potential pressure on green space.
For example, Gilbert Valley has a relatively high child population but only 0.884 sq km of parkland. Areas around Murray Bridge, Lobethal, Woodside, Mount Barker, and McLaren Vale also show significant child populations relative to limited green space.
Lighter yellow areas indicate fewer children relative to parkland area.
Blue boundary lines mark Local Government Areas (LGAs), allowing viewers to see how green space is distributed across council areas.
This map helps visualise not only where green space is located, but also how it relates to child populations and how it is spread across different council areas.
Data Source: ABS, Census
Data for Aboriginal children and young people
The current measure does not accurately reflect access to green space for Aboriginal and Torres Strait Islander children and young people. In remote regions such as the Anangu Pitjantjatjara Yankunytjatjara (APY) Lands and parts of the West Coast of South Australia, extensive natural environments exist. These areas are often not classified as “parkland” Mesh Blocks under the ABS land use classification system.
As a result, this approach may underrepresent green space in these regions. The limitation arises from the land use classification framework rather than an absence of natural environment.
Green spaces are shared public resources used by the broader community and calculating parkland per Aboriginal and Torres Strait Islander child does not reflect the shared nature of access and availability.
For these reasons, this measure is not suitable as a standalone measure of green space access specifically for Aboriginal and Torres Strait Islander children and young people.
Background and Rationale
Background:
This measure is conceptually informed by Hsu et al. (2022)1, which highlights the importance of combining population distribution and green space availability to understand spatial equity. Building on this, the current analysis derives “children per square kilometre of parkland” at the SA2 level to reflect demand and pressure on available green space.
In this analysis, green spaces are defined using Mesh Blocks classified as “Parkland” by the Australian Bureau of Statistics (ABS).
Mesh Blocks are the smallest geographic units defined by the ABS, forming the building blocks for all larger statistical areas in Australia. They typically represent up to 70 dwellings, so it’s highly detailed population data.
These parkland areas generally include:
- Public parks
- Nature reserves
- Public open space
- Protected or conserved areas
They may also include sporting arenas and facilities such as racecourses, golf courses, and stadiums.
All calculations in the map are based on dividing South Australia into Statistical Area Level 2 (SA2) regions.
According to ABS, Statistical Areas Level 2 (SA2s) are medium-sized general-purpose areas built up from whole Statistical Areas Level 1 (SA1s). Their purpose is to represent a community that interacts together socially and economically.
Limitations of the Analysis
Some of the limitations to be considered when interpreting the results:
- The analysis assumes that all parkland areas are fully available only for children.
- The ABS Parkland mesh block classification includes parks, nature reserves, public open space, protected or conserved areas (typically with zero population), sporting arenas and facilities (e.g., racecourses, golf courses, stadiums). Some of these areas may not be publicly accessible, which may overestimate practical access to green space for children.
- This measure does not account for quality, safety, accessibility (e.g., walking distance, transport access), or age-specific suitability of facilities.
Rationale:
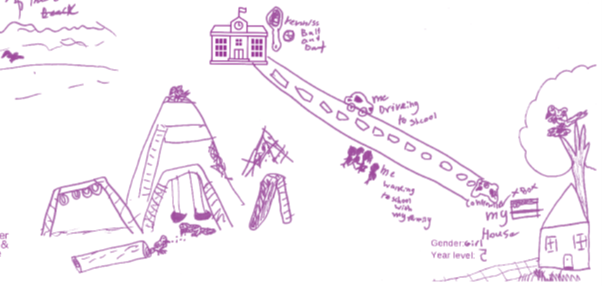
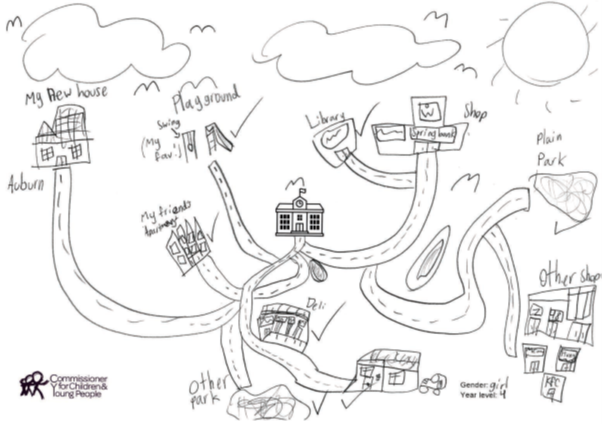
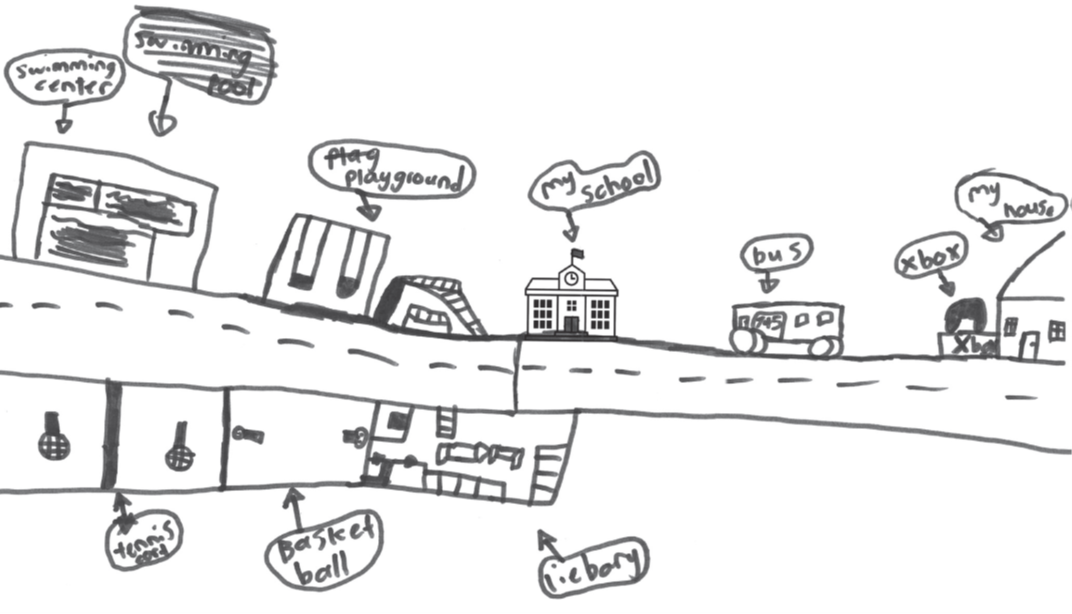
Source: Connolly, H. (2025), My Suburban Life, Commissioner for Children and Young People South Australia.
The report presents children’s own drawings of their neighbourhoods, highlighting the features they consider important. These drawings consistently show that parks, playgrounds, and open spaces are highly valued by children. This measure reflects children’s perspectives and priorities, helping to ensure that planning and policy decisions consider the spaces that matter most to them.
Access to green and blue spaces supports children’s physical development, mental wellbeing, helps prevent obesity, and provides opportunities for children to be active, socialize, and develop a sense of connection to their community.
11. Hsu, Y.-Y., Hawken, S., Sepasgozar, S., & Lin, Z.-H. (2022). Beyond the Backyard: GIS Analysis of Public Green Space Accessibility in Australian Metropolitan Areas. Sustainability, 14(8), 4694. https://doi.org/10.3390/su14084694In this analysis, green spaces are defined using Mesh Blocks classified as “Parkland” by the Australian Bureau of Statistics (ABS).Self-reported participation in organised activities
THIS FORCES THE TABS TO CLOSE INITIALLY
In 2024, 60.7% of Year 4 to Year 10 SA students (from all school sectors) felt connected to adults at their school (61.4% in 2019).
Data Source: Wellbeing and Engagement Collection, Australia
Data for all children and young people
School students in Years 4-12 in South Australia reported their participation in organised activities outside of school hours using a Low, Medium, and High wellbeing scale.
The bar graphs below show the distribution of participation responses.
Proportion of Year 4-12 student responses (2024)
Proportion of Years 4-6, 7-9 and 10-12 student responses (2024)
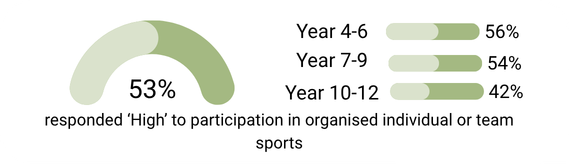
Results indicate that students in Years 4-6 tend to report higher participation in organised activities compared with students in other year levels.
Trend in ‘High’ participation of organised activities outside of school hours
This chart shows trends in the proportion of school students in South Australia reporting high participation in organised activities outside of school hours.
Results indicate that:
-
- The proportion of students reporting high participation declined overall between 2019 and 2024.
- The decline was most notable between 2019 and 2020, followed by a relatively stable trend with only minor year-to-year fluctuations.
- Specifically, participation decreased from 87% in 2019 to 75% in 2020, after which it remained relatively consistent, suggesting that the initial drop was not followed by further substantial changes.
The below section shows proportion of children who are developmentally on track across all AEDC domains further disaggregated by placement in care, disability status, Index of Educational Disadvantage (IOED), Location.
Select a disaggregation below to view the corresponding results.
By Placement in Care:
Children participating in self-organised activities who are under a guardianship order started at a relatively high level (77% in 2019), but participation declined significantly to 66% in 2021, representing the largest drop across all groups. This decline likely reflects increased vulnerability to external disruptions (e.g., the COVID-19 period). Participation shows a moderate recovery thereafter, reaching 71% in 2024.
Children under non-guardianship care consistently demonstrate higher levels of participation. Their relatively stable trend suggests stronger resilience, potentially due to better access to resources, stability, or support systems that enable engagement in activities.
By Disability
Children with disability consistently show lower participation in organised activities compared to children without disability.
By Index of Educational Disadvantage
Students living in areas with higher educational disadvantage show lower participation in self-organised activities. There is a clear gradient, where participation steadily increases as disadvantage decreases.
By Location
Children living in regional areas have lower participation in organised activities compared to those in metropolitan areas. This may reflect differences in access to structured programs, with children in country areas potentially engaging more in informal or unorganised activities instead.
Caveat: Percentages are calculated from students who provided a valid response to this question.
Data Source: Wellbeing and Engagement Collection, Australia
Data for Aboriginal children and young people
Proportion of Aboriginal and Non-Aboriginal student responses (2024)
Among Aboriginal students, 79% of students in Years 4-6 report high participation in organised activities. This proportion decreases to 70% for students in Years 7-9 and further to 61% for students in Years 10-12. Correspondingly, the proportion reporting low participation increases with age, reaching 28% among students in Years 10-12. Overall, 73% of Aboriginal students in Years 4-12 report high participation.
A similar pattern is observed among non-Aboriginal students, where 85% of students in Years 4-6 report high participation. This declines to 75% in Years 7-9 and 64% in Years 10-12. Low participation increases with age, rising to 24% among students in Years 10-12. Overall, 76% of non-Aboriginal students in Years 4-12 report high participation.
Across all year groups, non-Aboriginal students report slightly higher levels of high participation compared with Aboriginal students, although the overall trends across age groups are similar for both groups.
Participation in organised activities outside of school hours is generally high among government school students in South Australia, although participation decreases with age for both Aboriginal and Non-Aboriginal students.
Caveat: Percentages are calculated from students who provided a valid response to this question.
Data Source: Wellbeing and Engagement Collection, Australia
Background and Rationale
According to the WEC, organised activities refer to structured activities that children and young people participate in outside school hours, typically involving scheduled sessions, instruction, or organised groups.
These activities include organised individual or team sports (such as basketball, swimming, cricket, football, netball, or dancing), music lessons or practising a musical instrument (such as drums, guitar, violin, or piano), arts and crafts (such as painting or drawing), and participation in youth organisations (such as Scouts, Girl Guides, or Boys and Girls Clubs). These activities are generally facilitated by coaches, instructors, or organised groups and involve regular participation.
| High | Students who usually responded towards the positive end of the scale with response options including: ‘agree’, ‘strongly agree’, ‘most of the time’, ‘all of the time’, ‘very much true’, ‘mostly like me’ or ‘very much like me’. |
| Medium | Students who usually responded towards the middle of the scale or who reported a mix of positive and negative responses with response options including: ‘don’t agree or disagree’, ‘some of the time’, ‘somewhat like me’ or ‘neither positive or negative’. |
| Low | Students who usually responded towards the negative end of the scale with response options including: ‘disagree’, ‘strongly disagree’, ‘a little of the time’, ‘none of the time’, ‘not at all true’, ‘a little like me’ or ‘not at all like me’. |
Some of the disaggregations used for this measure are defined below:
A flag indicating whether a student is under the Guardianship of the Chief Executive.
Students are categorised as:
– Guardianship: Under the Guardianship of the Chief Executive
– Non-guardianship: Not under the Guardianship of the Chief Executive
– Unknown: Status not recorded or not known
A flag indicating if the student has a disability.
– Yes: Students with a disability
– No: Students without a disability
The Index of Educational Disadvantage (IOED) is a socio-economic index, used by the department to allocate resources to schools to address educational disadvantage related to socio-economic status.
The Index is calculated using measures of:
– Parental economic resources (ECO)
– Parental education and occupation (EDU)
– Aboriginality (AB)
– Student mobility (MOB).
Schools are ranked based on these measures and assigned an overall score, which is then grouped into seven categories ranging from most to least socio-educationally disadvantaged.
Rationale
After-school activities provide distinct and important opportunities for promoting children and young people’s development. Arts groups, sporting clubs and community organisations may give children and young people experiences that benefit their social competence.
Participation in structured after-school activities has been shown to boost students’ competence and self-esteem, school engagement and personal satisfaction. Studies have also found a link between participation in after-school activities and higher school grades.
Self-reported participation in sports or recreational physical activities
THIS FORCES THE TABS TO CLOSE INITIALLY
In 2024, 60.7% of Year 4 to Year 10 SA students (from all school sectors) felt connected to adults at their school (61.4% in 2019).
Data Source: Wellbeing and Engagement Collection, Australia
Data for all children and young people
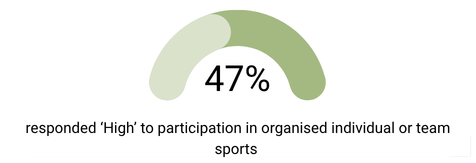
School students in Years 4-12 in South Australia reported the degree of student participation in team or individual sports using a low, medium, and high wellbeing scale.
Proportion of Year 4-12 student responses (2025)
The section below presents the proportion of student’s level of belongingness to school, disaggregated by Year levels, NESB (Non-English-speaking background), EALD (English as an Additional Language or Dialect) and Disability.
Caveat: Percentages are calculated from students who provided a valid response to this question.
Data Source: Wellbeing and Engagement Collection, Australia
Data for Aboriginal children and young people
Aboriginal school students in Years 4-12 in South Australia reported the degree of student participation in team or individual sports using a low, medium, and high wellbeing scale.
Proportion of Aboriginal Year 4-12 student responses (2025)
The graph compares participation in sports among Aboriginal and/or Torres Strait Islander students and Non-Indigenous students from 2019 to 2025 across three participation categories: High, Medium, and Low.
For both Indigenous and Non-Indigenous students, the “High” participation category consistently represents the largest proportion across all years. However, Non-Indigenous students generally show higher percentages of high participation than Aboriginal and/or Torres Strait Islander students throughout the period.
Among Aboriginal and/or Torres Strait Islander students, ‘High’ participation declined noticeably between 2019 and 2020, dropping from around 49% to about 41% in 2021, before gradually increasing again to 46.5% by 2025. For Non-Indigenous students, ‘High’ participation remained comparatively stable, generally staying between 50% and 58% across the period. Although there was a decline around 2019-2020 from 55% to 48%, participation levels recovered by 2025.
Caveat: Percentages are calculated from students who provided a valid response to this question.
Data Source: Wellbeing and Engagement Collection, Australia
Background and Rationale
Background:
Participated in organised or team sports after school refers to students taking part in structured recreational physical activities such as basketball, swimming, football, or netball outside school hours.
For the disaggregation of school belongingness:
Year level breakdown is derived directly from student age as follows:
- Age_ID ≥ 8 and ≤ 11 is classified as Years 4–6
- Age_ID ≥ 12 and ≤ 15 is classified as Years 7–9
- Age_ID ≥ 16 and ≤ 19 is classified as Years 10–12
NESB (Non-English Speaking Background) codes represent the following categories:
- A (Aboriginal language): Students who identify as Aboriginal and who speak an Aboriginal language, including Aboriginal English. This excludes Aboriginal students who only speak standard Australian English. Codes TR, P1, P2 and P3 should not be used for Aboriginal students.
- P1 (Definition 1 permanent resident): Permanent resident or Australian citizen students born overseas with at least one parent or guardian from a non-English speaking background. This includes children adopted by English-speaking families who have maintained a linguistic link with their country of origin. If the P1 code is used, the student’s country of birth must not be Australia and the date of arrival in Australia must be completed.
- P2 (Definition 2 permanent resident): Permanent resident or Australian citizen students born in Australia with at least one parent or guardian born overseas and from a non-English speaking background.
- P3 (Definition 3 permanent resident): Permanent resident or Australian citizen students born in Australia, not included in the previous two definitions, who have maintained a cultural identity and family link with a language other than English.
- TR (Temporary resident): Students who are not permanent residents in Australia and who come from non-English speaking countries. If a student with a TR visa becomes a permanent resident, the NESB code needs to change (i.e., to P1, P2 or P3).
Please note this is students’ status at the time of undertaking the WEC.
EALD (English as an Additional Language or Dialect) refers to a flag used to indicate whether a student requires EALD support.
Students from a non-English speaking background (NESB) who need support to learn English must have the “EALD Support Required” flag enabled. When this is activated, it opens the EALD support details screen where the student’s Learning English: Achievement and Proficiency (LEAP) level is recorded. It is important to note that not all NESB students require EALD support.
The disability flag identifies students with a disability, where the values align with the Inclusive Education Support Program (IESP). Up to three codes may be recorded to identify the disability or disabilities of each student.
| Code | Disability |
|---|---|
| A | Autism Spectrum |
| C | Communication (Early Intervention) |
| D | Cognitive Delay (Early Intervention) |
| H | Hearing |
| I | Intellectual |
| L | Language |
| P | Physical |
| V | Vision |
| X | Complex social/emotional/behaviour needs |
| Y | Complex/acute health care |
Rationale:
Measuring sports participation is important because it reflects engagement in structured, beneficial activities that support children’s academic achievement, mental health, and overall development. The pandemic led to widespread disruptions in organised sport due to social distancing and the suspension of community programs, resulting in reduced participation and a shift toward more screen-based activities. These changes were compounded by factors such as cancelled memberships, financial and logistical barriers to rejoining sport, and shifts in parental attitudes towards participation. As restarting organised sport often requires sustained motivation and support, tracking sports participation provides a useful indicator of how well children are re-engaging with healthy, structured activities following pandemic-related disruptions, and helps inform policies aimed at restoring participation and reducing reliance on sedentary behaviours (Zhou et al., 2026).
South Australia’s Report Card for children and young people

- 11. Hsu, Y.-Y., Hawken, S., Sepasgozar, S., & Lin, Z.-H. (2022). Beyond the Backyard: GIS Analysis of Public Green Space Accessibility in Australian Metropolitan Areas. Sustainability, 14(8), 4694. https://doi.org/10.3390/su14084694In this analysis, green spaces are defined using Mesh Blocks classified as “Parkland” by the Australian Bureau of Statistics (ABS).