
|
|
Indicator:Children and young people are connected to family, friends and communities |
Measures:Having someone to ask for any type of supportParticipating in cultural and/or creative activitiesAttending cultural venues and eventsFeeling connected to adults in their school |
Having someone to ask for any type of support
THIS FORCES THE TABS TO CLOSE INITIALLY
Data Source: Wellbeing and Engagement Collection, Australia
Data for all children and young people
1. Confiding in Friends
School students in Years 4-12 in South Australia reported the quality of social support from peers using a low, medium, and high wellbeing scale, based on having friends they can confide in, talk to when upset, or who understand them.
Proportion of Year 4-12 student responses (2024)
Proportion of Years 4-6, 7-9 and 10-12 student responses (2024)
Results indicate that students in Years 4-6 tend to report stronger social support from peers compared with students in other year levels.
Proportion of students reporting ‘High’ confiding in friends
Proportion of students reporting high levels of friendship intimacy remains relatively stable over time, with only minor fluctuations across year levels.
Younger students (Years 4-6) maintain the strongest outcomes throughout the period, with percentages remaining in the low-to-mid 70s and showing a slight recovery in 2024 after a small dip in earlier years. In contrast, students in Years 10-12 show a gradual decline from 2019 to 2023, followed by a modest improvement to 64% in 2024, though still remaining below younger cohorts.
The middle group (Years 7-9) follows a similar but slightly declining trend over time, indicating a gradual reduction in high friendship intimacy as students’ progress through school. The aggregated group (Years 4-12) mirrors this pattern, showing a slight downward trend from 2019 to 2023, with a recovery in 2024.
These patterns suggest that friendship intimacy tends to decrease with age, particularly during later schooling years, before showing some improvement in the most recent period. The consistency of this gradient across years indicates a stable relationship between year level and connectedness with peers.
The section below presents the proportion of children in government schools who report a ‘High’ level of confiding in friends, disaggregated by placement in care, disability status, Index of Educational Disadvantage (IOED), and location.
Select a disaggregation below to view the corresponding results.
By Placement in Care:
Children not under a guardianship order consistently report higher levels of confiding in friends compared to those who are under a guardianship. This group remains the highest across all years, although there is a slight decline from 70% in 2019 to around 67% in 2022 and 2023, followed by a small increase to 68% in 2024.
Children under the Guardianship of the Chief Executive show more variability, with a notable increase from 62% in 2019 to 67% in 2020. Unlike other groups, their levels do not decline during the COVID period but shows some recovery.
By Disability:
Children with disability are more likely to report low levels of confiding in friends compared to those without disability. However, the overall pattern across year levels is similar for both groups, with higher levels of support reported in younger years (Year 4-6) and a decline as children get older.
Overall, 62% of students with disability in Years 4-12 reported a high level of connection to friends, compared with 69% of students without disability. Disability is associated with a moderate but consistent disadvantage in access to trusted support networks.
By Index of Educational Disadvantage (IOED):
A clear socioeconomic gradient is evident in children’s reported access to support, with those living in less disadvantaged areas consistently reporting higher levels of support compared to those in more disadvantaged areas. Children in the most disadvantaged areas (IOED 1-2) report the lowest levels of support, at approximately 61-66%, while those in the least disadvantaged areas (IOED 6-7) report the highest levels, around 68-72%. This represents a clear stepwise increase across the socioeconomic spectrum, with an overall gap of about 8-10 percentage points between the most and least advantaged groups.
Although all groups experienced a decline in 2023, most notably among the most disadvantaged group, which fell to around 61%, there was a general recovery in 2024 across all IOED categories. However, this recovery did not close the gap between groups, indicating that inequality persists over time. Overall, the pattern highlights that socioeconomic disadvantage remains a strong and consistent driver of inequality in children’s access to support networks, with disadvantaged children being more vulnerable to system-wide shocks and less likely to have someone to turn to for help.
By Location:
Although the differences between students living in metropolitan and country regions are statistically significant, the magnitude of the difference is small. Approximately 69% of students in metropolitan areas report confidence in friends compared to 67% of students in country areas, indicating only a minimal practical difference despite statistical significance.
Data Source: Wellbeing and Engagement Collection, Australia
Data for Aboriginal children and young people
1. Confiding in Friends
Aboriginal government school students in Years 4-12 in South Australia reported the quality of social support from peers using a low, medium, and high wellbeing scale, based on having friends they can confide in, talk to when upset, or who understand them.
Proportion of Year 4-12 student responses (2024)
Proportion of Years 4-6, 7-9 and 10-12 student responses (2024)
Results indicate that students in Years 4-6 tend to report stronger social support from peers compared with students in other year levels.
Proportion of students reporting ‘High’ confiding in friends
This chart shows trends in the proportion of Aboriginal and non-Aboriginal government school students in South Australia who responded “High” for confiding in friends over six years.
Results indicate that:
- both Aboriginal and non-Aboriginal students show relatively stable levels of responding ‘High’ in confiding in friends from 2019 to 2024.
- the proportion of Aboriginal students reporting ‘High’ wellbeing remains around 65-67%, while the proportion for non-Aboriginal students is slightly higher, at approximately 67-70%.
- the gap between Aboriginal and non-Aboriginal students remains consistent at around 3-4 percentage points over this period.
Data Source: Wellbeing and Engagement Collection, Australia
Background and Rationale
Background:
Having someone to ask for support reflects if students feel they can turn to others when they need help. One aspect of this Measure is ‘confiding in friends’, which captures student responses to a Wellbeing and Engagement Collection question about having at least one close friend to talk to when something is bothering them, a friend they can tell everything to, and someone their own age who really understands them. School students in Years 4-12 in South Australia indicated their level of confiding in friends using a high, medium, and low wellbeing scale.
| High | Students who usually responded towards the positive end of the scale with response options including: ‘agree’, ‘strongly agree’, ‘most of the time’, ‘all of the time’, ‘very much true’, ‘mostly like me’ or ‘very much like me’. |
| Medium | Students who usually responded towards the middle of the scale or who reported a mix of positive and negative responses with response options including: ‘don’t agree or disagree’, ‘some of the time’, ‘somewhat like me’ or ‘neither positive or negative’. |
| Low | Students who usually responded towards the negative end of the scale with response options including: ‘disagree’, ‘strongly disagree’, ‘a little of the time’, ‘none of the time’, ‘not at all true’, ‘a little like me’ or ‘not at all like me’. |
Some of the disaggregations used for this measure are defined below:
A flag indicating whether a student is under the Guardianship of the Chief Executive.
Students are categorised as:
– Guardianship: Under the Guardianship of the Chief Executive
– Non-guardianship: Not under the Guardianship of the Chief Executive
– Unknown: Status not recorded or not known
A flag indicating if the student has a disability.
– Yes: Students with a disability
– No: Students without a disability
The Index of Educational Disadvantage (IOED) is a socio-economic index measured at the school level, used by the department to allocate resources to schools to address educational disadvantage related to socio-economic status.
The Index is calculated using measures of:
– Parental economic resources (ECO)
– Parental education and occupation (EDU)
– Aboriginality (AB)
– Student mobility (MOB).
Schools are ranked based on these measures and assigned an overall score, which is then grouped into seven categories ranging from most to least socio-educationally disadvantaged.
Rationale:
It is important to collect this data as access to trusted support is a key determinant of children and young people’s social and emotional wellbeing. Having at least one person to confide in is associated with improved mental health outcomes, increased resilience, and better capacity to cope with stress and challenges.
Measuring whether students have someone they can turn to for support provides insight into the strength and availability of informal support networks within school environments. This information can guide the development of policies and interventions aimed at strengthening student wellbeing, enhancing early support mechanisms, and ensuring that schools are environments where students feel safe, supported, and able to seek help when needed.
Participating in cultural and/or creative activities
THIS FORCES THE TABS TO CLOSE INITIALLY
Data Source: Wellbeing and Engagement Collection, Australia
Data for all children and young people
Types of cultural activities undertaken by South Australian children
In 2021-22, most Australian children aged 5 to 14 years (96.2%) participated in at least one cultural activity outside of school hours during the previous 12 months, representing a slight increase from 95.3% in 2017-18. However, this increase was almost entirely driven by participation in screen-based activities, while participation in nearly all other activities declined.
The bar chart above presents the types of cultural activities undertaken by South Australian children aged 5-14 for 2017-18 and 2021-22.
- Screen-based activities are the most common cultural activity, with participation above 90% during 2017-18 and 2021-22. This suggests digital engagement dominates children and young people’s leisure time.
- Reading for pleasure is also very common (around 70–80%), though slightly lower than screen-based activities.
- Art and craft activities show moderate engagement (around 40-45%), indicating a reasonable level of creative participation.
- Singing or playing a musical instrument and creative writing fall in the mid-range (17% during 2021-22), suggesting more specialised or skill-based creative activities are less common.
- Drama activities are among the least participated (around 5–8%).
These results suggest that passive engagement (screen-based activities) is significantly higher than active or creative participation (e.g., drama, music, creative writing, digital creation). While overall participation in at least one activity is high, deeper creative engagement appears more limited.
Data Source: Cultural and creative activities, ABS
Data for Aboriginal children and young people
Background and Rationale
Background:
Cultural activities provide important opportunities for children and young people to connect with others. The Australian Bureau of Statistics (ABS) definitions of cultural activities include participation in drama, singing, playing a musical instrument, dancing, art and craft, creative writing and creating digital content.
The data presented is derived from the Multipurpose Household Survey (MPHS), a sample survey of private dwellings conducted by the Australian Bureau of Statistics (ABS). Percentages shown are weighted estimates based on ABS survey weights, which are applied to ensure results are representative of the broader population rather than only the survey sample.
Rationale:
Cultural activities in the areas of art, ethnicity, food, language, music, nationality, and religion can affect development including cognitive, emotional, social, physical, and language development.
Attending cultural venues and events
THIS FORCES THE TABS TO CLOSE INITIALLY
Data Source: Wellbeing and Engagement Collection, Australia
Data for all children and young people
• 84.5% of children and young people attended at least one cultural venue or event (80.1% nationally).
Data Source: Cultural and creative activities, ABS
Data for Aboriginal children and young people
Background and Rationale
• cultural events include attending libraries and archives, art galleries, museums, cinemas, live music concerts, theatre, dance and other performing arts.
Feeling connected to adults in their school
THIS FORCES THE TABS TO CLOSE INITIALLY
Data Source: Wellbeing and Engagement Collection, Australia
Data for all children and young people
School students in Years 4-12 in South Australia reported their sense of connection to adults at school through the following:
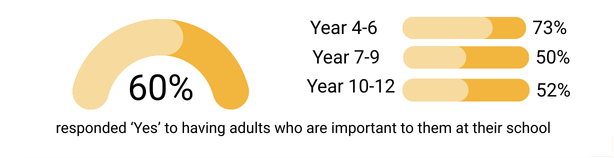
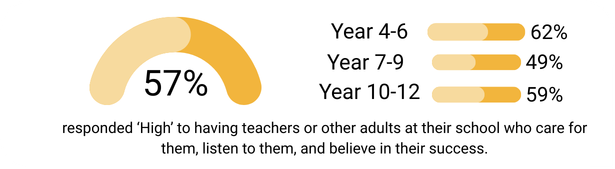
1. Important adult at school (2024)
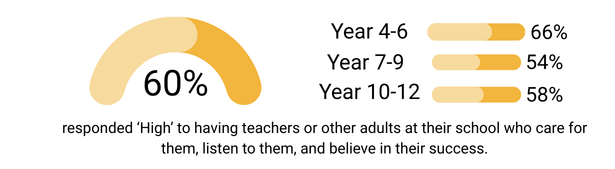
2. Connectedness to school (2024)
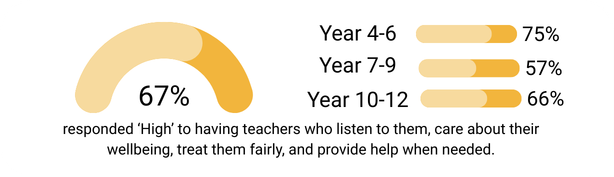
3. Emotional engagement with teachers (2024)
Trends in ‘High’ Emotional Engagement with teachers
This chart shows trends in the proportion of school students in South Australia, reporting a “High” level of emotional engagement with teachers over six years.
Results indicate that:
-
the proportion of students who reported a ‘High’ level of emotional engagement with teachers declined modestly overall between 2019 and 2024
-
the decline was gradual, with relatively small year-to-year changes, suggesting a slight weakening in students perceived emotional connection with teachers over time
-
a noticeable dip occurred in 2023, followed by a slight increase in 2024.
1. Important adult at school (2024)
The section below presents the proportion of students in government schools reporting whether they have an important adult at school disaggregated by placement in care, disability status, Index of Educational Disadvantage (IOED), and location.
Select a disaggregation below to view the corresponding results.
Caveat: Percentages are calculated from students who provided a valid response to this question.
Data Source: Wellbeing and Engagement Collection, Australia
Data for Aboriginal children and young people
Aboriginal government school students in Years 4-12 in South Australia reported their sense of connection to adults at school through the following:
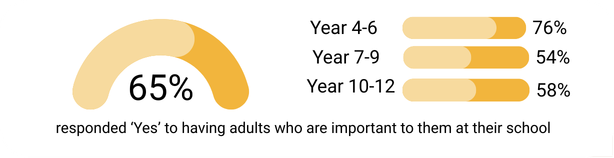
1. Important adult at school (2024)
2. Connectedness to school (2024)
3. Emotional engagement with teachers (2024)
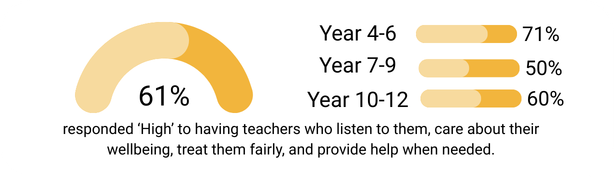
These results highlight that students in Year 4-6 feel more connected to adults at school compared with those in Years 7-12, which influences the overall percentage.
Trends in ‘High’ Emotional Engagement with teachers
This chart shows trends in the proportion of Aboriginal and non-Aboriginal government school students in South Australia, reporting “High” wellbeing over six years.
Results indicate that:
- the proportion of students who responded ‘High’ to having emotional engagement with teachers declined overall between 2019 and 2024 for both Aboriginal and Non-Aboriginal government school students.
- among Aboriginal children and young people, responses indicating a ‘High’ level were relatively stable between 2019 and 2021 at around 66-67%. In 2022, this proportion declined to approximately 65%, reaching its lowest point in 2023 at 61%. In 2024, levels remained low at 61%, well below pre-2022 levels.
- both groups show a similar pattern over time, with trends moving in the same direction.
Caveat: Percentages are calculated from students who provided a valid response to this question.
Data Source: Wellbeing and Engagement Collection, Australia
Background and Rationale
Background:
Students feeling connected to adults in their school is captured by assessing whether they have an important adult at school. Levels of wellbeing are represented on a low, medium, and high scale based on students’ perceptions that teachers care about them, listen to them, believe in their success, all of which contribute to ‘connectedness to school’. ‘Emotional engagement with teachers’ includes teachers showing interest in students’ wellbeing, listening to what students have to say, providing extra help when needed, and treating students fairly.
Some of the disaggregations used for this measure are defined below:
A flag indicating whether a student is under the Guardianship of the Chief Executive.
Students are categorised as:
– Guardianship: Under the Guardianship of the Chief Executive
– Non-guardianship: Not under the Guardianship of the Chief Executive
– Unknown: Status not recorded or not known
A flag indicating if the student has a disability.
– Yes: Students with a disability
– No: Students without a disability
The Index of Educational Disadvantage (IOED) is a socio-economic index, used by the department to allocate resources to schools to address educational disadvantage related to socio-economic status.
The Index is calculated using measures of:
– Parental economic resources (ECO)
– Parental education and occupation (EDU)
– Aboriginality (AB)
– Student mobility (MOB).
Schools are ranked based on these measures and assigned an overall score, which is then grouped into seven categories ranging from most to least socio-educationally disadvantaged.
Rationale:
This is a critical measure because children and young people need care and support from adults at home, at school, and in their communities. Positive relationships help them feel connected, build resilience, reduce engagement in risky behaviours, and prepare for a successful transition into adulthood.