
|
|
Indicator:Children have a healthy early life |
Measures:Rate of infant mortalityFully Immunised at 1, 2 and 5 years
Meeting developmental milestones at 2 and 4 years |

Rate of infant mortality
THIS FORCES THE TABS TO CLOSE INITIALLY
In 2024, 60.7% of Year 4 to Year 10 SA students (from all school sectors) felt connected to adults at their school (61.4% in 2019).
Data Source: Wellbeing and Engagement Collection, Australia
Data for all children and young people
Click the legend to include other states
- South Australia’s Infant Mortality (under 1 years old) rate has been lower than the national average for the majority of the past 40 years.
- Since 2011, the SA Infant Mortality rate has been less than 3.5 per 1,000 live births per year.
- In 2023, the SA Infant Mortality Rate was 2.7 per 1,000 live births and in comparison to the national rate of 3.2 per 1,000 live births.
- NSW, VIC and ACT have had similar trends to SA for the past 12 years.
Data Source: ABS, Death
Data for Aboriginal children and young people
Click the legend to include other states
- South Australia’s Infant Mortality (under 1 years old) rate has been decreasing since the start of 2003.
- SA’s infant mortality rate appears to fluctuate: this is due to the small number of cases (less than 10 cases of infant mortality per annum).
- In 2023, the SA Infant Mortality Rate was 4.2 per 1,000 live births.
- NSW have had similar trends to SA since 2003.
Data Source: ABS, Death
Background and Rationale
Fully Immunised at 1, 2 and 5 years
THIS FORCES THE TABS TO CLOSE INITIALLY
In 2024, 60.7% of Year 4 to Year 10 SA students (from all school sectors) felt connected to adults at their school (61.4% in 2019).
Data Source: Wellbeing and Engagement Collection, Australia
Data for all children and young people
Click the legend to include other states
- Since 2001, SA has been following closely with the national percentage of fully vaccinated one year olds.
- In 2023, 93.3% of one year olds were fully vaccinated in SA and in comparison 93.2% were fully vaccinated nationally.
Click the legend to include other states
- SA has been following closely with the national percentage of fully vaccinated two year olds.
- In 2023, 92% of two year olds were fully vaccinated in SA and in comparison 91.2% were fully vaccinated nationally.
Note: Three additional vaccines were included in the definition of fully immunised for 2 year olds in January 2015 and March 2017.
Click the legend to include other states
- The percentage of five year olds fully vaccinated has been rising since 2005 and South Australia has been aligned with the nationally percentage.
- In 2023, 95% of five year olds were fully vaccinated in SA and in comparison 93.9% were fully vaccinated nationally.
Immunisation percentages did not vary much by region in 2022. For example, in five year olds most regions recorded the same 95% immunised statistic: Adelaide City (88.8% immunised) and Fleurieu – Kangaroo Island (91.9% immunised) are the only two regions that are significantly below the state average.
Data Source: Australian Childhood Immunisation Register
Data for Aboriginal children and young people
Click the legend to include other states
- Since 2015, SA has been close to the national percentage of fully vaccinated one year olds.
- In 2023, 89% of one year olds were fully vaccinated in SA and in comparison 90.4% were fully vaccinated nationally.
Click the legend to include other states
- Since 2015, SA has been close to following closely with the national percentage of fully vaccinated two year olds.
- In 2023, 87.7% of two year olds were fully vaccinated in SA and in comparison 88.8% were fully vaccinated nationally.
Click the legend to include other states
- The percentage of five year olds fully vaccinated has been rising since 2009 and South Australia has been aligned with the national percentage.
- In 2023, 94.7% of five year olds were fully vaccinated in SA and in comparison 95.4% were fully vaccinated nationally.
Data Source: Australian Childhood Immunisation Register
Background and Rationale
Meeting developmental milestones at 2 and 4 years
THIS FORCES THE TABS TO CLOSE INITIALLY
In 2024, 60.7% of Year 4 to Year 10 SA students (from all school sectors) felt connected to adults at their school (61.4% in 2019).
Data Source: Wellbeing and Engagement Collection, Australia
Data for all children and young people
Ages and Stages Questionnaire (ASQ) – The ASQ, Third Edition (ASQ-3), is a developmental screening tool used to assess children’s development across five domains: communication, gross motor, fine motor, problem-solving, and personal-social skills.
An overview of the dataset used and obtained from Child and Family Health Service (CaFHS) is given below:
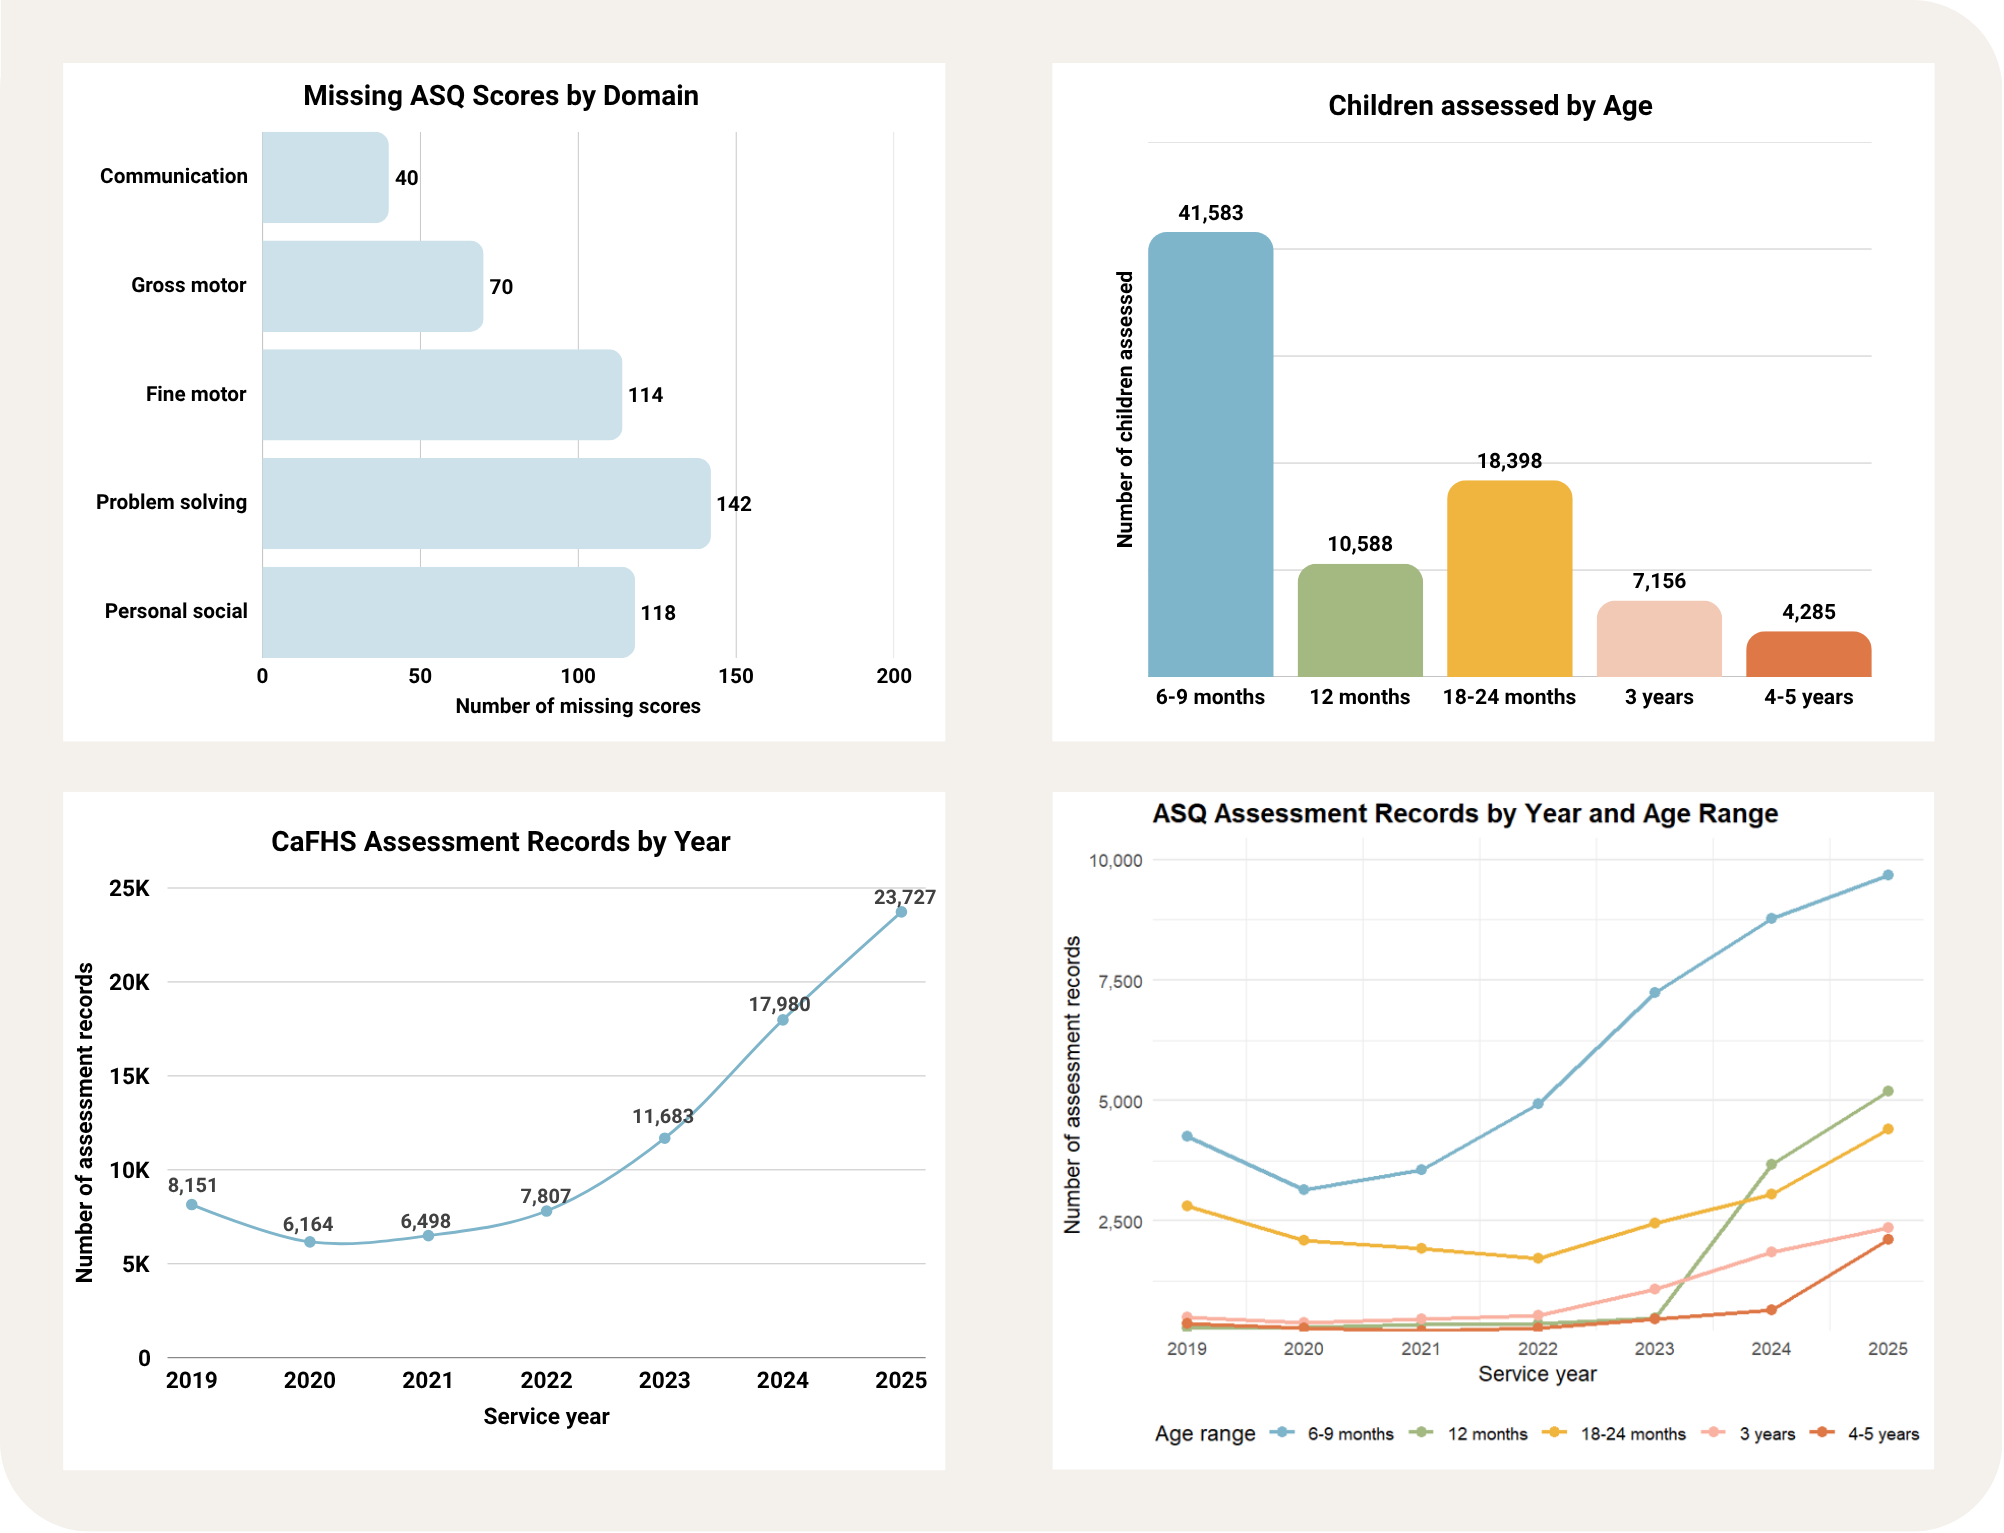
Overall Distribution of Categories by Domain:
These categories are based on the monitoring-zone thresholds specified for each ASQ assessment and developmental domain. Further details on the classification methodology are provided in the Background section.
Across all developmental domains, at least 85% of children fall within the Typical Development category, with relatively small proportions in the Monitoring Zone and Below Cut-off categories. Gross motor development has the lowest proportion of children in the Typical Development category compared with the other developmental domains in 2025.
Developmental patterns by age
Screening coverage
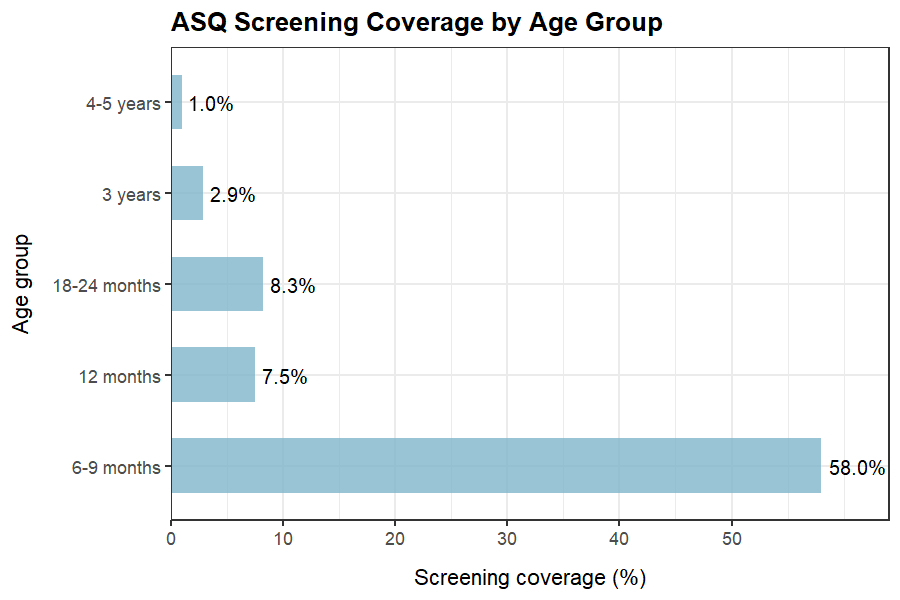
The proportion of children assessed relative to the estimated population decreases with age. Assessment coverage is highest among children aged 6-9 months, at approximately 58%, declining to around 1% among children aged 4-5 years.
These findings should be interpreted with caution, as the population denominators for each age group were estimated using Australian Bureau of Statistics (ABS) data. Further details on the population estimation methodology are provided in the Background section.
Trend of Typical Development Category by Domain
Across ASQ developmental domains, the proportion of assessments classified as typical development generally increased across several age groups, particularly children aged 4-5 years, while children aged 6-9 months consistently recorded highest proportions. However, trends varied across age groups and domains, with some fluctuations and notable increases in the latest year.
These findings should be interpreted alongside assessment volumes and coverage, as they reflect children assessed through CaFHS rather than the developmental outcomes of all South Australian children.
Score Distribution by Domain and Age ranges > |
The link above presents combined violin and boxplots showing the distribution of ASQ scores across developmental domains and age ranges in 2025. The violin plots illustrate the density of scores, while the boxplots show the median and interquartile range (25th and 75th percentiles), with whiskers indicating the spread of scores according to the plotting method.
The distributions suggest that, among children aged 6-9 months, the monitoring-zone threshold for the gross motor domain intersects the 25th percentile. Across all other domains and age ranges, the monitoring zone appears to encompass a relatively small proportion of scores.
Screening Outcomes by Remoteness
Across developmental domains, the proportions of outcomes were broadly similar across remoteness categories, with modest differences in the percentage classified as Typical development, Monitoring zone and Below cut-off. However, the number of assessment records varied considerably between remoteness categories. These differences in assessment volumes should be considered when interpreting the results, as estimates for categories with fewer assessments may be less precise.
Data for Aboriginal children and young people
This graph summarises the number of developmental domains in which children reached the Typical Development stage, allowing comparisons between Aboriginal and non-Aboriginal children. Aboriginal children had slightly higher percentages of children with no domains or only one domain at the Typical Development stage. However, these differences were small, and the gap has narrowed over time.
Background and Rationale
Background:
One of the measures used to assess the proportion of children meeting developmental milestones is the Ages and Stages Questionnaire (ASQ). The ASQ is a developmental screening tool administered at specific ages to assess children across five domains:
- Communication: Assesses language skills, both what a child understands and how they follow directions (receptive) and how they vocalize, use words, and start to make sentences (expressive)
- Gross motor: Assesses large muscle movement and coordination (body, arms, and legs)
- Fine motor: Assesses eye–hand and hand–finger movements and coordination, and pre-writing skills
- Problem solving: Assesses skills of thinking and learning, how child solves problems, and pre-academic skills
- Personal-social: Assesses self-help skills (e.g., feeding, dressing, toileting) and social interactions with others
Based on the scores for each domain and the relevant ASQ questionnaire, children are classified into three categories: Below cut-off, Monitoring zone, and Typical development. Screening coverage represents the proportion of the estimated population screened, while developmental outcomes reflect only the children who completed ASQ screening. Children scoring below the established cut-off are classified as Below cut-off, indicating a potential developmental concern; those scoring within the monitoring zone may benefit from closer monitoring and follow-up; and those scoring above the monitoring threshold are classified as Typical development, indicating development within the expected range for their age.
To estimate ASQ screening coverage across different age ranges, the number of children screened is compared with the estimated population in the corresponding age cohort. Population estimates are derived from Australian Bureau of Statistics (ABS) population data, with adjustments made to account for the proportion of each year of age that falls within the relevant screening age range. The population denominator for each age range is calculated as follows:
- 6-9 months: Four-twelfths of the estimated population aged under one year is used to represent the four-month screening period.
- 12 months: Three-twelfths of the estimated population aged one year is used to represent a three-month screening period.
- 18-24 months: Eight-twelfths of the estimated population aged one year is combined with seven-twelfths of the estimated population aged two years to account for the relevant screening periods across the two age cohorts.
- 3 years: Ten-twelfths of the estimated population aged three years is used to represent the ten-month screening period.
- 4-5 years: The full estimated population aged four years is combined with one-twelfth of the estimated population aged five years to account for the relevant screening period across both age cohorts.
The analysis uses data obtained from CaFHS through established data-sharing agreements. These data are used to examine developmental screening outcomes and coverage across age groups and, where data permit, across geographic areas and population subgroups.
According to ABS, Statistical Areas Level 2 (SA2s) are medium-sized general-purpose areas built up from whole Statistical Areas Level 1 (SA1s). Their purpose is to represent a community that interacts together socially and economically.
Limitation: These findings should be interpreted alongside assessment volumes and screening coverage, as they reflect the developmental outcomes of children assessed through CaFHS and may not be representative of all children in South Australia. This limitation is particularly relevant for older age groups, where assessment volumes and screening coverage may be lower. Differences in screening uptake, data availability and small numbers in some geographic areas may further affect the interpretation of results.
Rationale:
Early childhood development plays a critical role in shaping children’s long-term health, wellbeing, learning and life outcomes. Evidence from the Australian Early Development Census (AEDC) demonstrates that developmental vulnerability in the early years is associated with outcomes later in life, highlighting the importance of identifying developmental needs early and providing appropriate support.
The Child and Family Health Service (CaFHS) developmental screening data, collected through the Ages and Stages Questionnaire (ASQ), provides a complementary perspective by capturing information about children’s development through parents and caregivers, who have first-hand knowledge of their children’s behaviours, abilities and everyday experiences. This information can help identify developmental concerns, monitor developmental progress and inform early intervention and service planning.
However, the usefulness of these data depends on sufficient and representative screening coverage across age groups. Greater coverage, particularly among older children, would provide a more comprehensive understanding of developmental outcomes beyond infancy and the early toddler years. Restricting routine screening requirements to younger children may limit the ability to identify emerging developmental concerns as children grow and their developmental needs change.